Making the data usable
For a long time, the gallery's data told whatever story you needed it to tell. Not because anyone was being dishonest, but because every department was working from their own slice of it. Marketing had their numbers. Digital sales had theirs. Accounting had theirs. When leadership asked a question that crossed those lines, they'd get three answers, each defensible, none complete.
The problem wasn't entirely the data. It was that nobody had ever built the infrastructure to hold all of it at once, and nobody had ever agreed on what the numbers meant. Marketing and digital sales had maintained separate definitions of success for years, producing different figures for the same activity. The disagreement wasn't a data problem, it was a language problem. You can't build on each other's work if you're not speaking the same language.
The disagreement wasn't a data problem, it was a language problem. You can't build on each other's work if you're not speaking the same language.
I'm not a data scientist, but I was able to bring over a decade of knowing the gallery's data inside out: what existed, what could be inferred, what it couldn't actually tell you, and how the underlying systems related to each other. That turned out to be most of what was needed. The analysts and engineers could build once they knew what they were building toward. My job was to get everyone to agree on what that was.
We consolidated data from multiple systems into a centralized warehouse, cleaned and linked datasets across departments, and established shared definitions for key metrics: what counted as a digital sale, how attribution worked, what various inbound channels actually meant. We also built a tiered library of reusable datasets so that future reports could draw from common foundations rather than being rebuilt from scratch each time. Once those definitions and shared resources existed, departments stopped arguing about whose numbers were right and started building on each other's work. Reports that used to take weeks to assemble took hours. And findings that only became visible once everything was in one place quietly changed how leadership thought about parts of the business.
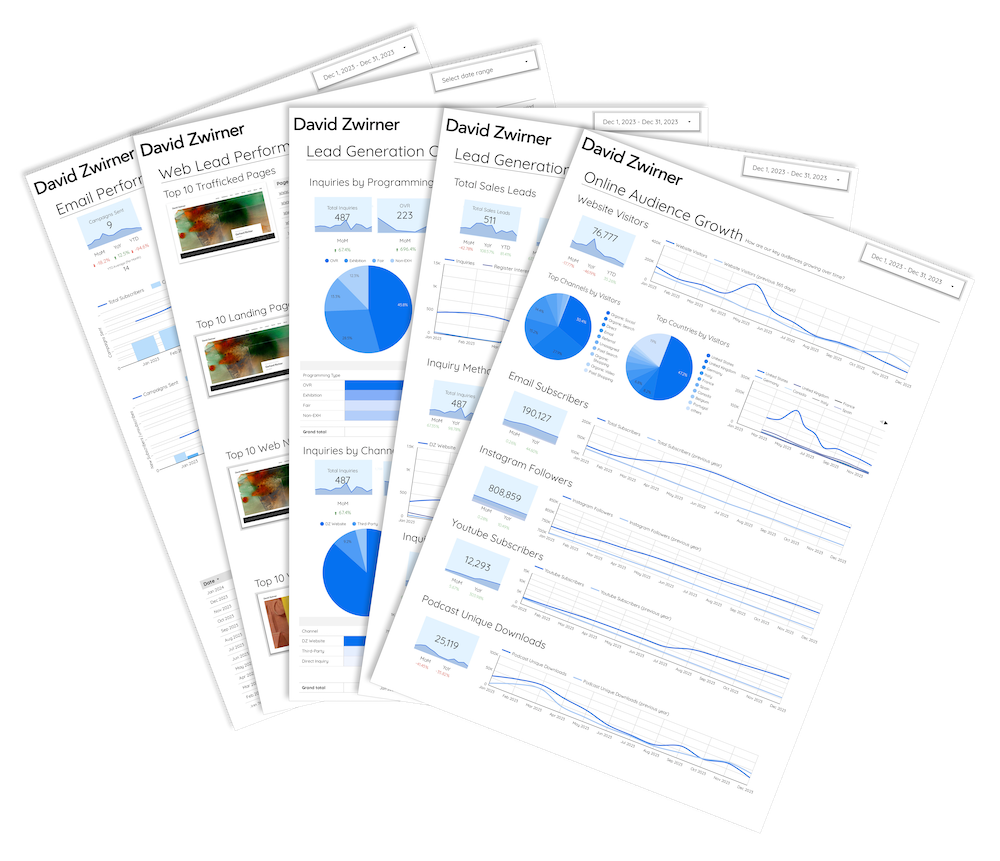
Custom reports reduced report generation time by 80%.